
Policy Brief: Understanding Housing, Transportation, and Inequality Trends through Spatial Analysis
Policy Brief: Understanding Housing, Transportation, and Inequality Trends through Spatial Analysis (2015–2023) Using the Urban Land Institute’s Housing Attainability Interactive Mapping Tool
What the Maps Reveal
The following maps illustrate a clear set of dynamics shaping Raleigh and surrounding areas between 2015 and 2023. Across four critical indicators: population growth, housing cost trends (both ownership and rental) and commuting patterns common themes emerge. Rapid and uneven growth, growing economic inequality, worsening housing affordability, and declining transportation access for many communities.
As Raleigh prepares to draft its next Comprehensive Plan, these maps offer both a diagnostic lens and a call to action. Below is a summary of the findings, policy implications, and a set of recommendations that can inform a more equitable, affordable, and connected future for Raleigh and the region.

1. Population Growth is Concentrated in Lower-Cost Areas
This map shows the population change from 2015 to 2023 by census tract. The deepest red tracts signifying 20% to 800% population growth are primarily located in southern and eastern Wake County. These are historically lower-cost areas. Growth there reflects that affordability as well as where housing supply is more readily available.
By contrast, much of inside-the-beltline Raleigh shows relatively modest growth or even population loss. While being some of the most resource-rich areas of Raleigh because of proximity to job centers, transit, and infrastructure, it remains largely dominated by exclusionary zoning that limits housing types and increased density. More recently, perpetuating the use of “Character Preservation” tools like Neighborhood Conservation Overlay Districts and even Historic Overlay Districts have added to the ability of wealthier neighborhoods to further restrict the ability to add diverse housing options in these already protected areas.
Also, it is worth noting that there are a few exceptions to this pattern where developers were able to assemble large tracts of land and entitle them using planned development districts and master plans. These include North Hills/Midtown, Brier Creek, Downtown South, and the Crabtree Valley area – all areas identified as growth centers in the 2030 Comprehensive Plan Growth Framework Map and Future Land Use Map.
Implication: Areas with the least amount of infrastructure are experiencing the heaviest growth pressures. With a few exceptions, the City’s high-opportunity core remains relatively static, while new population growth is pushed to the periphery and beyond.
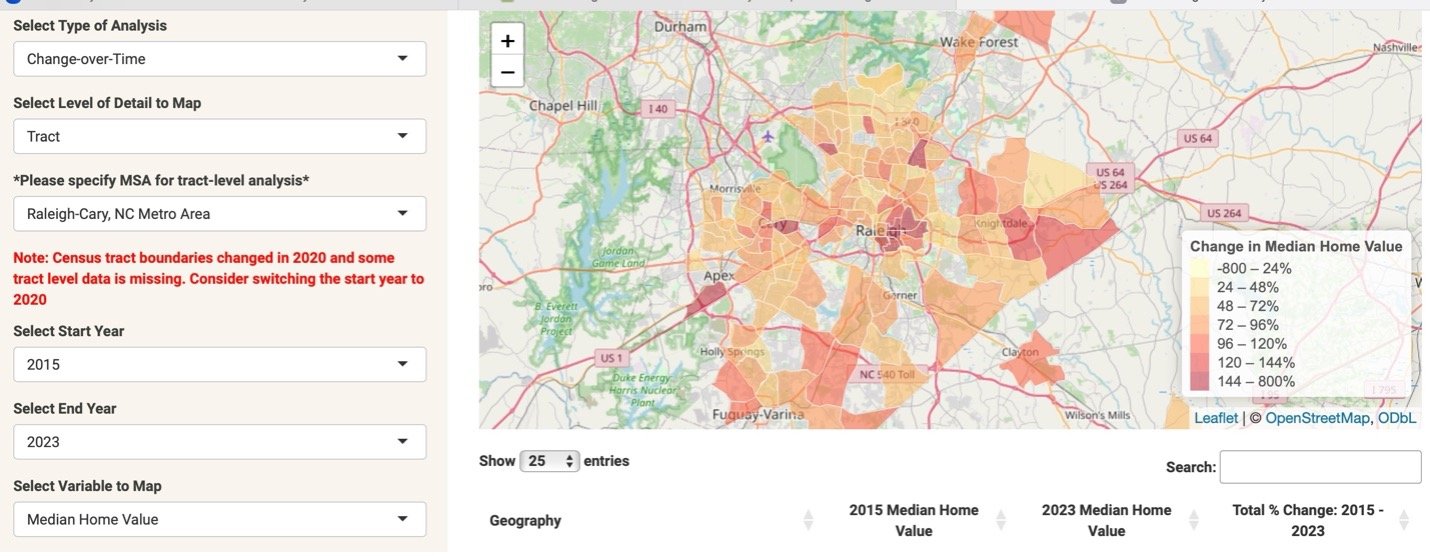
2. Home Values Have Increased Broadly, but More Intensely in Lower Cost Areas
This map tracks the percent change in median home values. Notably, high growth areas south and east of Raleigh show increases exceeding 120%. These changes reflect the high demand for what were affordable areas.
Higher-income areas such as Hayes Barton and Five Points, and other neighborhoods inside the Beltline saw significant property value increases, although they experienced minimal population growth. This is primarily due to limited availability of new and diverse housing options. Regulatory barriers make it challenging to add new housing supply, resulting in newcomers replacing existing homes with larger and more expensive houses. Close-in neighborhoods in southeast Raleigh, which have historically housed Black, Latino and working-class residents, have experienced explosive increases in value as high income residents have moved in to snap up homes near amenity-rich Downtown.
Implication: Wealth gains through property appreciation are heavily concentrated in areas insulated from growth pressures by exclusionary zoning policies. This perpetuates historic racial and economic inequality because housing supply constraints disproportionately inflate home values for those lucky enough to own a home in these resource-rich areas, while displacing residents from lower-cost neighborhoods. There is ample research supporting this assertion and can be found on RaleighForward’s resource page.

3. Rents Are Climbing Fastest in the Same Tracts Where Population Is Rising Most Sharply
This map, showing change in rental costs, closely mirrors the home value trend. Tracts with the highest rent increases (64% or more) overlap with areas experiencing intense demand for new housing. This is especially pronounced in southern and eastern Wake County.
These overlapping trends suggest a region where neither renters nor buyers are insulated from cost pressures. As residents chase the areas with new supply, rents escalate accordingly.
Implication: Renters face mounting pressures and have even fewer options for achieving economic stability than homeowners. Without action, wealth disparities will only get worse as Raleigh’s lower income, working-class population are forced to move beyond the City’s boundaries. A recent study by the National Low Income Housing Coalition supports this conclusion.

4. Long Commutes Are Becoming More Common in the Outlying Suburbs
The final map illustrates the change in percentage of residents with commutes longer than one hour. Tracts in southern Wake County (Fuquay-Varina, Garner, Holly Springs, and portions of East Raleigh) saw sharp increases in long commutes.
As lower-income, working class families are priced out of resource-rich areas, they are pushed further away from areas of social and economic opportunity. The lack of regional transit exacerbates these trends, imposing a time and financial penalty on those least able to afford it.
Implication: Economic mobility is undermined where more affordable housing options are in areas without access to jobs and transit. Transportation and housing must be planned together to enhance economic mobility and prosperity.
Recommendations
Raleigh should address these converging challenges with a sense of urgency. The following recommendations build on this data and align with core principles of economic opportunity, social mobility, and resilience.
1. Expand and Strengthen Missing Middle Housing Reforms
Because areas with diverse housing types absorb population growth more efficiently, Raleigh should double down on its Missing Middle reforms by:
Legalizing small apartments, townhomes, duplexes and triplexes citywide.
Joining with other large metropolitan regions and local housing advocates to support statewide legalization of single-stair construction and other regulatory reforms so 6–12-unit residential buildings can be built on small, infill lots.
Upzoning more property for moderate density mixed use/mixed income near proposed BRT routes, high frequency bus corridors and other major thoroughfares.
2. Upzone High-Income, Low-Growth Areas
Many of the Raleigh’s most exclusive neighborhoods with good schools, transit access, and public amenities remain relatively static. To expand housing supply and diversify housing options in these areas, Raleigh should:
Use the new Comprehensive Planning process to designate “Housing Priority Areas” in high-opportunity neighborhoods to encourage housing reforms that will diversify housing options.
Explore regulatory reforms to streamline the entitlement process for projects seeking to add more affordable infill development.
Upzone land to spur continued development in areas like Downtown, Midtown, Brier Creek, Downtown South and West Raleigh to absorb as much population growth as possible in these high opportunity areas with existing infrastructure.
Strategically upzone strip centers, car dealerships and other underutilized properties citywide.
3. Integrate Housing and Transit Planning More Effectively
To address growing commute burdens and support equitable mobility:
Accelerate development within transit overlay districts around BRT lines, with a mix of income-restricted and market-rate housing.
Expand the application of the Frequent Transit Development Option (TC-20-21).
Support Wake Transit Plan implementation by coordinating proactive land use decisions with anticipated transit investments.
Explore ways to accelerate construction of Raleigh’s BRT system and expansion of high frequency bus routes. A new transit tax plan for Mecklenburg County is under consideration at the NCGA this session.
Work with regional partners (e.g., Cary, Knightdale and Garner) to coordinate zoning standards for increasing density along key transit corridors.
Continue expanding the Capitol Area Greenway system and finding ways to integrate it with the region’s bike/ped plans and transit systems.
Look for opportunities to build “greenway-oriented development” that includes diverse land uses, housing and connections to varied transit options.
Conclusion
These maps tell a clear story: Raleigh and Wake County are growing, but in a way that risk deepening economic inequality, diminishing access to opportunity and permanently fragmenting the region. For decades, high resource areas in Raleigh’s core have exported the negative externalities of growth to outlying areas. Exclusionary zoning practices are a major culprit that perpetuates past institutional racist practices like racial covenants and redlining.
While present circumstances result from decisions made over decades, now is the time to act. Raleigh is beginning to make progress by eliminating parking minimums, enacting Missing Middle Reforms, legalizing ADU’s and adopting Transit Overlay Districts, but more must be done. Raleigh’s next Comprehensive Plan offers an excellent opportunity to develop new policies to help reverse these trends. Implementing such changes will take political courage, but if elected officials fail to act, Raleigh is at risk of losing its rich diversity and becoming a stagnate enclave of the wealthy.
Note to readers: Social and economic inequality are complex issues that researchers and writers build entire careers on, so no single blog post can ever do the topic justice. With that in mind, be on the lookout for future articles discussing the impact of racial covenants on wealth disparities, as well as more specific ways Raleigh can address housing affordability.